Beyond the Bottom Line on the Quote: Calculating What That RFQ Bid Actually Costs You

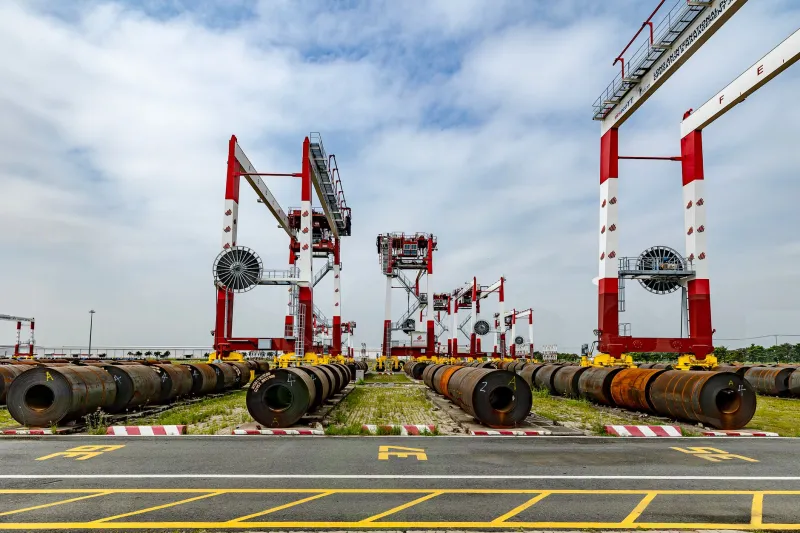
Photo: doe-oakridge, Public domain, via Wikimedia Commons
Every sourcing professional in America has sat through the same meeting. Three quotes on the screen. One is 8% lower than the rest. The room nods, the PO goes out, and everyone moves on to the next fire.
Six months later, that supplier is three weeks late on a revised drawing, shipping FOB Origin on a trucking rate nobody budgeted, and the quality team is sorting a 4% reject rate on a machined housing. The 8% savings is gone. Nobody connects the dots on paper.
This is the spec sheet lie in its most common form: unit price masquerading as total cost.
Where the Quote Ends and the Cost Begins
A quotation answers one question — what does the supplier charge per part at a given volume? It says nothing about what the purchase will actually consume once it enters your operation.
Consider what a typical industrial RFQ leaves on the table:
- Tooling and setup amortization. Some suppliers quote tooling separately, some bury it in piece price, some spring it on you at revision B. If you don't normalize this across bidders, you're comparing apples to invoices.
- Freight terms and logistics. A part quoted FOB Origin from 1,200 miles away carries freight exposure, receiving labor, and expedite risk that an FOB Destination quote from a regional shop doesn't.
- Engineering and NPI support. When your drawing changes, does the supplier absorb the DFM review, or does every revision arrive with a change-order invoice? For buyers in early production, this can dwarf the unit-price delta.
- Quality and rework economics. A 2% reject rate on a $12 part isn't a supplier problem — it's your line stoppage, your re-inspection labor, your expedited replacement freight.
- Payment terms. Net 30 versus Net 60 on a $2M annual spend is real working capital, whether or not it shows up on the quote comparison.
A Worked Example
Take a fabricated bracket, 10,000 units annually, three bidders:
| Line Item | Bidder A | Bidder B | Bidder C |
|---|---|---|---|
| Unit price | $14.20 | $14.95 | $15.40 |
| Tooling (amortized/yr) | $18,000 | $6,000 | $0 (existing die) |
| Freight (FOB Origin, est.) | $9,500 | $4,200 | $0 (FOB Dest.) |
| Est. rejects (2% / 0.5% / 0.5%) | $2,840 | $748 | $770 |
| Engineering changes (est. 2/yr) | $6,000 | $2,500 | $1,200 |
| Terms value (vs. Net 30 baseline) | +$1,400 | +$700 | $0 |
| Annual TCO | $219,740 | $213,148 | $161,370 |
Bidder A — the "cheapest" quote by 5% — lands roughly $58,000 per year more expensive than the highest unit price on the page. Multiply that across a portfolio of 40 active RFQs and the arithmetic becomes a boardroom conversation.
The TCO Template to Run Before You Award
You don't need a software suite to fix this. You need discipline and a one-page model:
- Normalize the unit price. Strip out embedded tooling so every bid is compared on manufacturing cost alone.
- Add amortized tooling and setup. Divide total tooling by expected annual volume over the tool's life.
- Load landed logistics. Freight, duty, receiving inspection, and a weighted expedite allowance based on the supplier's historical OTD performance.
- Price the quality gap. Reject rate × unit cost × (internal rework multiplier — typically 3–5× for the disruption, not just the scrap).
- Attach an engineering support rate. Estimated annual ECO hours × supplier's quoted change rate, or zero if contractually absorbed.
- Quantify terms. Discount or surcharge the working-capital difference against your cost of capital.
- Score the soft factors separately. Capacity headroom, financial stability, and communication quality won't fit in the spreadsheet, but they belong in the award rationale.
Run this consistently and a funny thing happens: the bidding field reshuffles. Regional suppliers with slightly higher quotes but shorter lines, better terms, and cleaner quality records start winning on merit. And the suppliers who lived on lowball unit pricing have to compete on the whole relationship — which is where they should have been competing all along.
Making It Stick
The obstacle isn't analytical; it's cultural. Awarding the low quote is defensible in any audit. Awarding a 6% higher quote because your TCO model says so requires a documented methodology and the backing of leadership.
So write the methodology down. Require the TCO worksheet as an attachment to every sourcing recommendation above a threshold. Review the model's predictions against actuals annually — the rejects you forecast versus the rejects you ate, the change orders you priced versus the ones invoiced.
The cheapest supplier is the one whose total invoice, including everything you didn't see coming, comes in lowest. In industrial procurement, that's rarely the bidder who won the spreadsheet.